Hope. Despair. Resistance. Timeseries.
Visualizing social change to inspire hope and spark resistance.
“Authoritarians want people to be so resigned and hopeless and feeling that it’s their destiny to be in political situations without agency and rights that they give up.”
Ruth Ben-Ghiat 2021
“If you want a picture of the future, imagine a boot stamping on a human face—forever.”
“1984”, George Orwell 1949
A boot stomping on your face seems quite unpleasant, even just once. But it's the 'forever' that makes Orwell's imagery so chilling. And that's the point. Tyrants and abusers get their power by making people feel stuck. When we lose hope in the possibility of change, we stop fighting for it.
Feeling stuck also supports gentler injustices, like inequality in the United States. It makes us more compliant and accepting of the status quo.
System Justification Theory suggests that when people feel stuck in crappy circumstances, we invent reasons to justify those crappy circumstances. And the more stuck we feel, the more we justify. So inequality might be self-perpetuating because it feels so permanent.
But there's hope! This vicious cycle of self-sabotage is no match for.... line charts?!
Timeseries: The humble, hopeful chart of change.
Let's look at a clever study on perceived inequality, from Kris-Stella Trump (at Johns Hopkins) and Ariel White (at MIT).
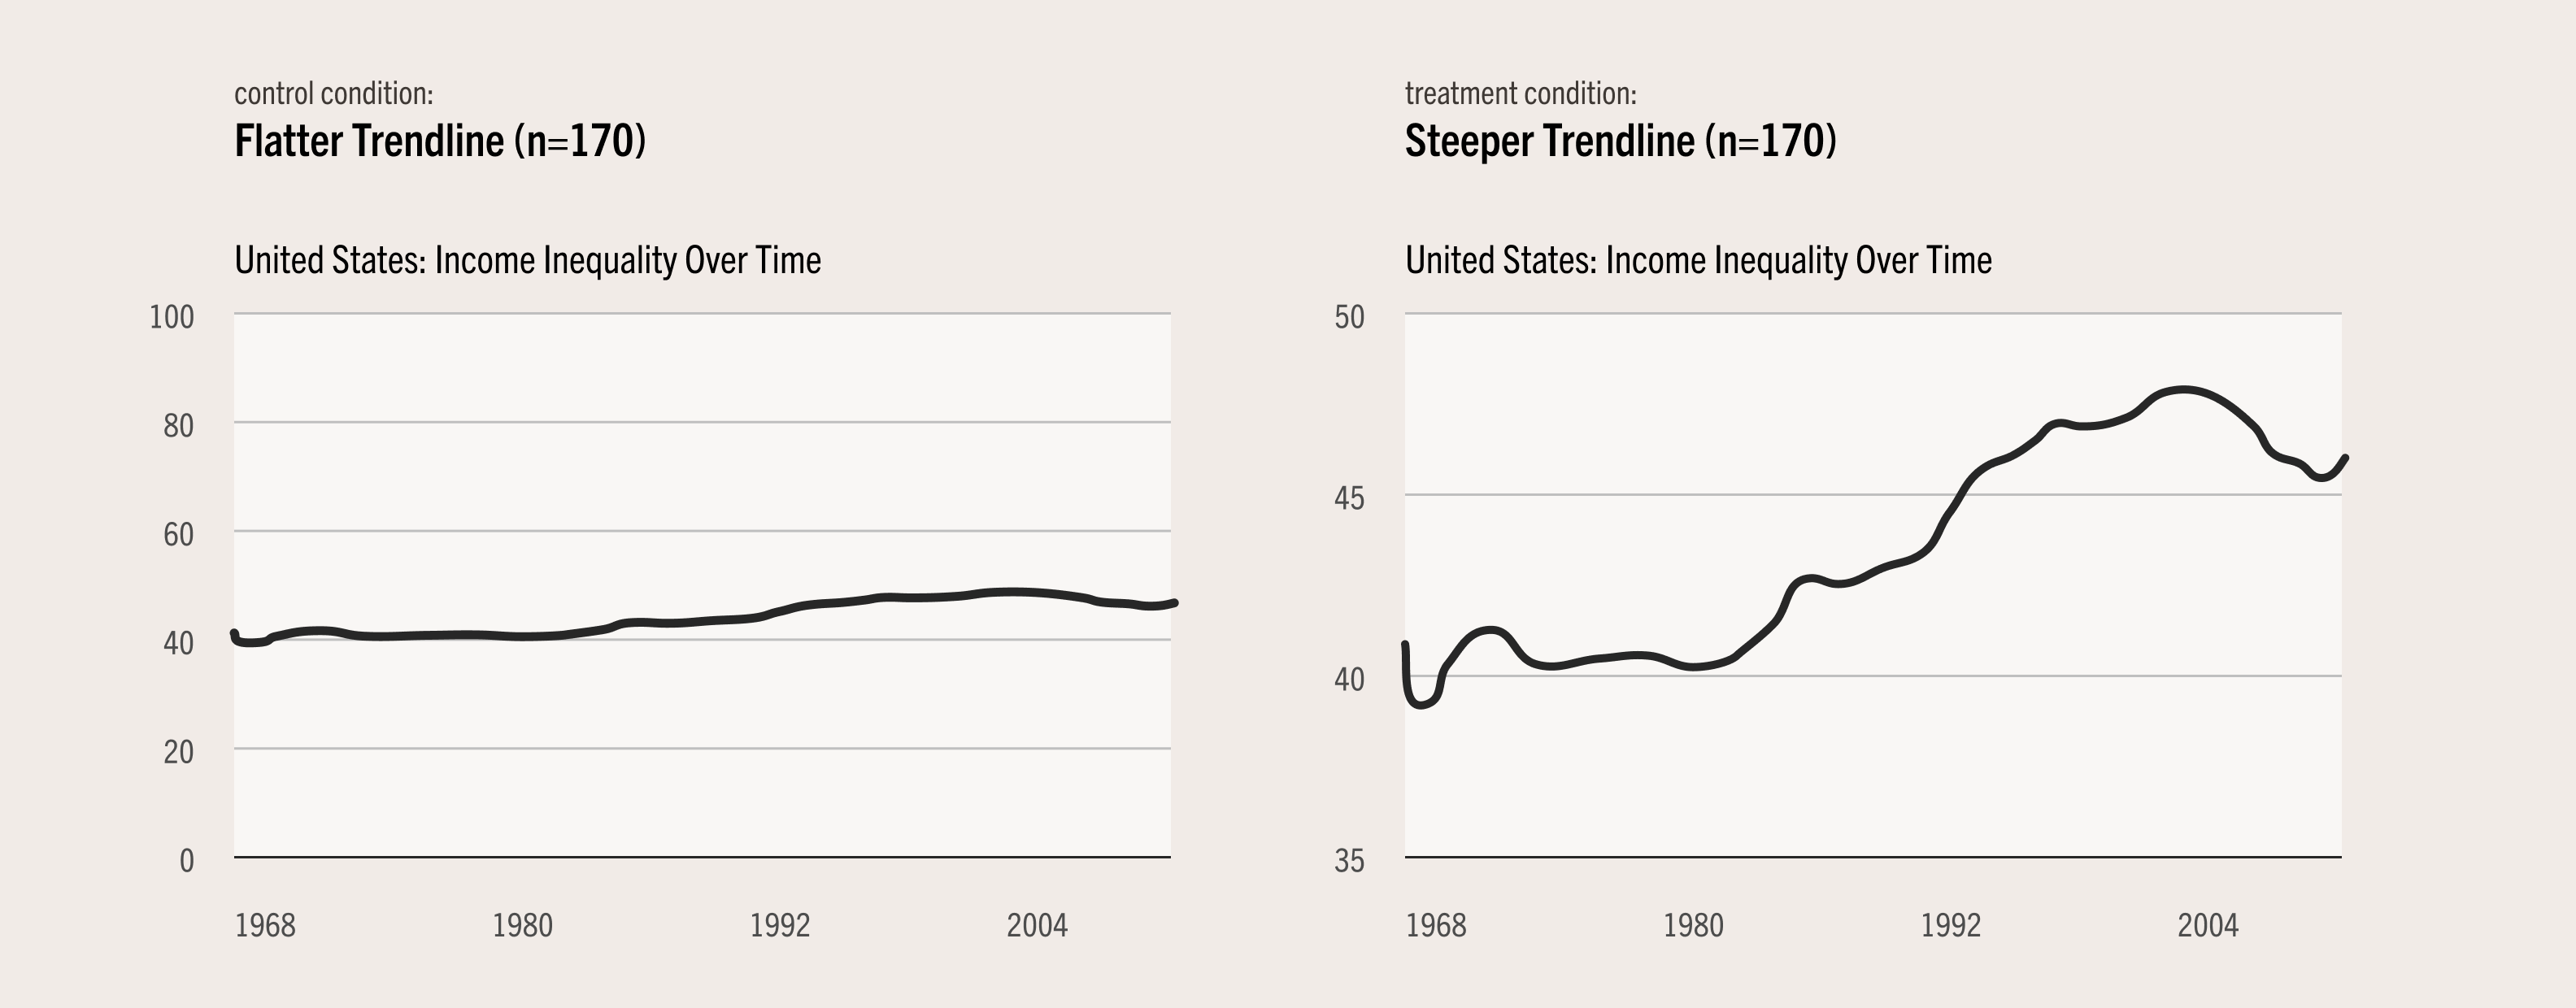
These two timeseries charts are from “Does Inequality Beget Inequality? Experimental Tests of the Prediction that Inequality Increases System Justification Motivation” (KS Trump & White 2018).
In the study, half the participants saw the Flatter Trendline chart on the left, the other half saw the Steeper Trendline chart on the right. Both of these charts use the same data. In fact, they're identical except for one key difference:
- Flatter Trendline shows the full y-axis (0–100).
- Steeper Trendline shows a compressed y-axis (35-50).
Since viewers often overlook axis scales, the Flatter Trendline chart suggests inequality is relatively stable, while the compressed scale for Steeper Trendline suggests more rapid change and a higher final value.
After seeing the charts, participants answered "system justification" questions like:
- Do "you find society to be fair?"
- Does "the American political system operate as it should?"
- Do you think "society is set up so that people usually get what they deserve?"
According to the researchers, System Justification Theory suggests that the Steeper Trendline chart should increase system justification, since it implies greater inequality. The more unfair society seems in the chart, the more people would rationalize it.
But that’s not what happens.
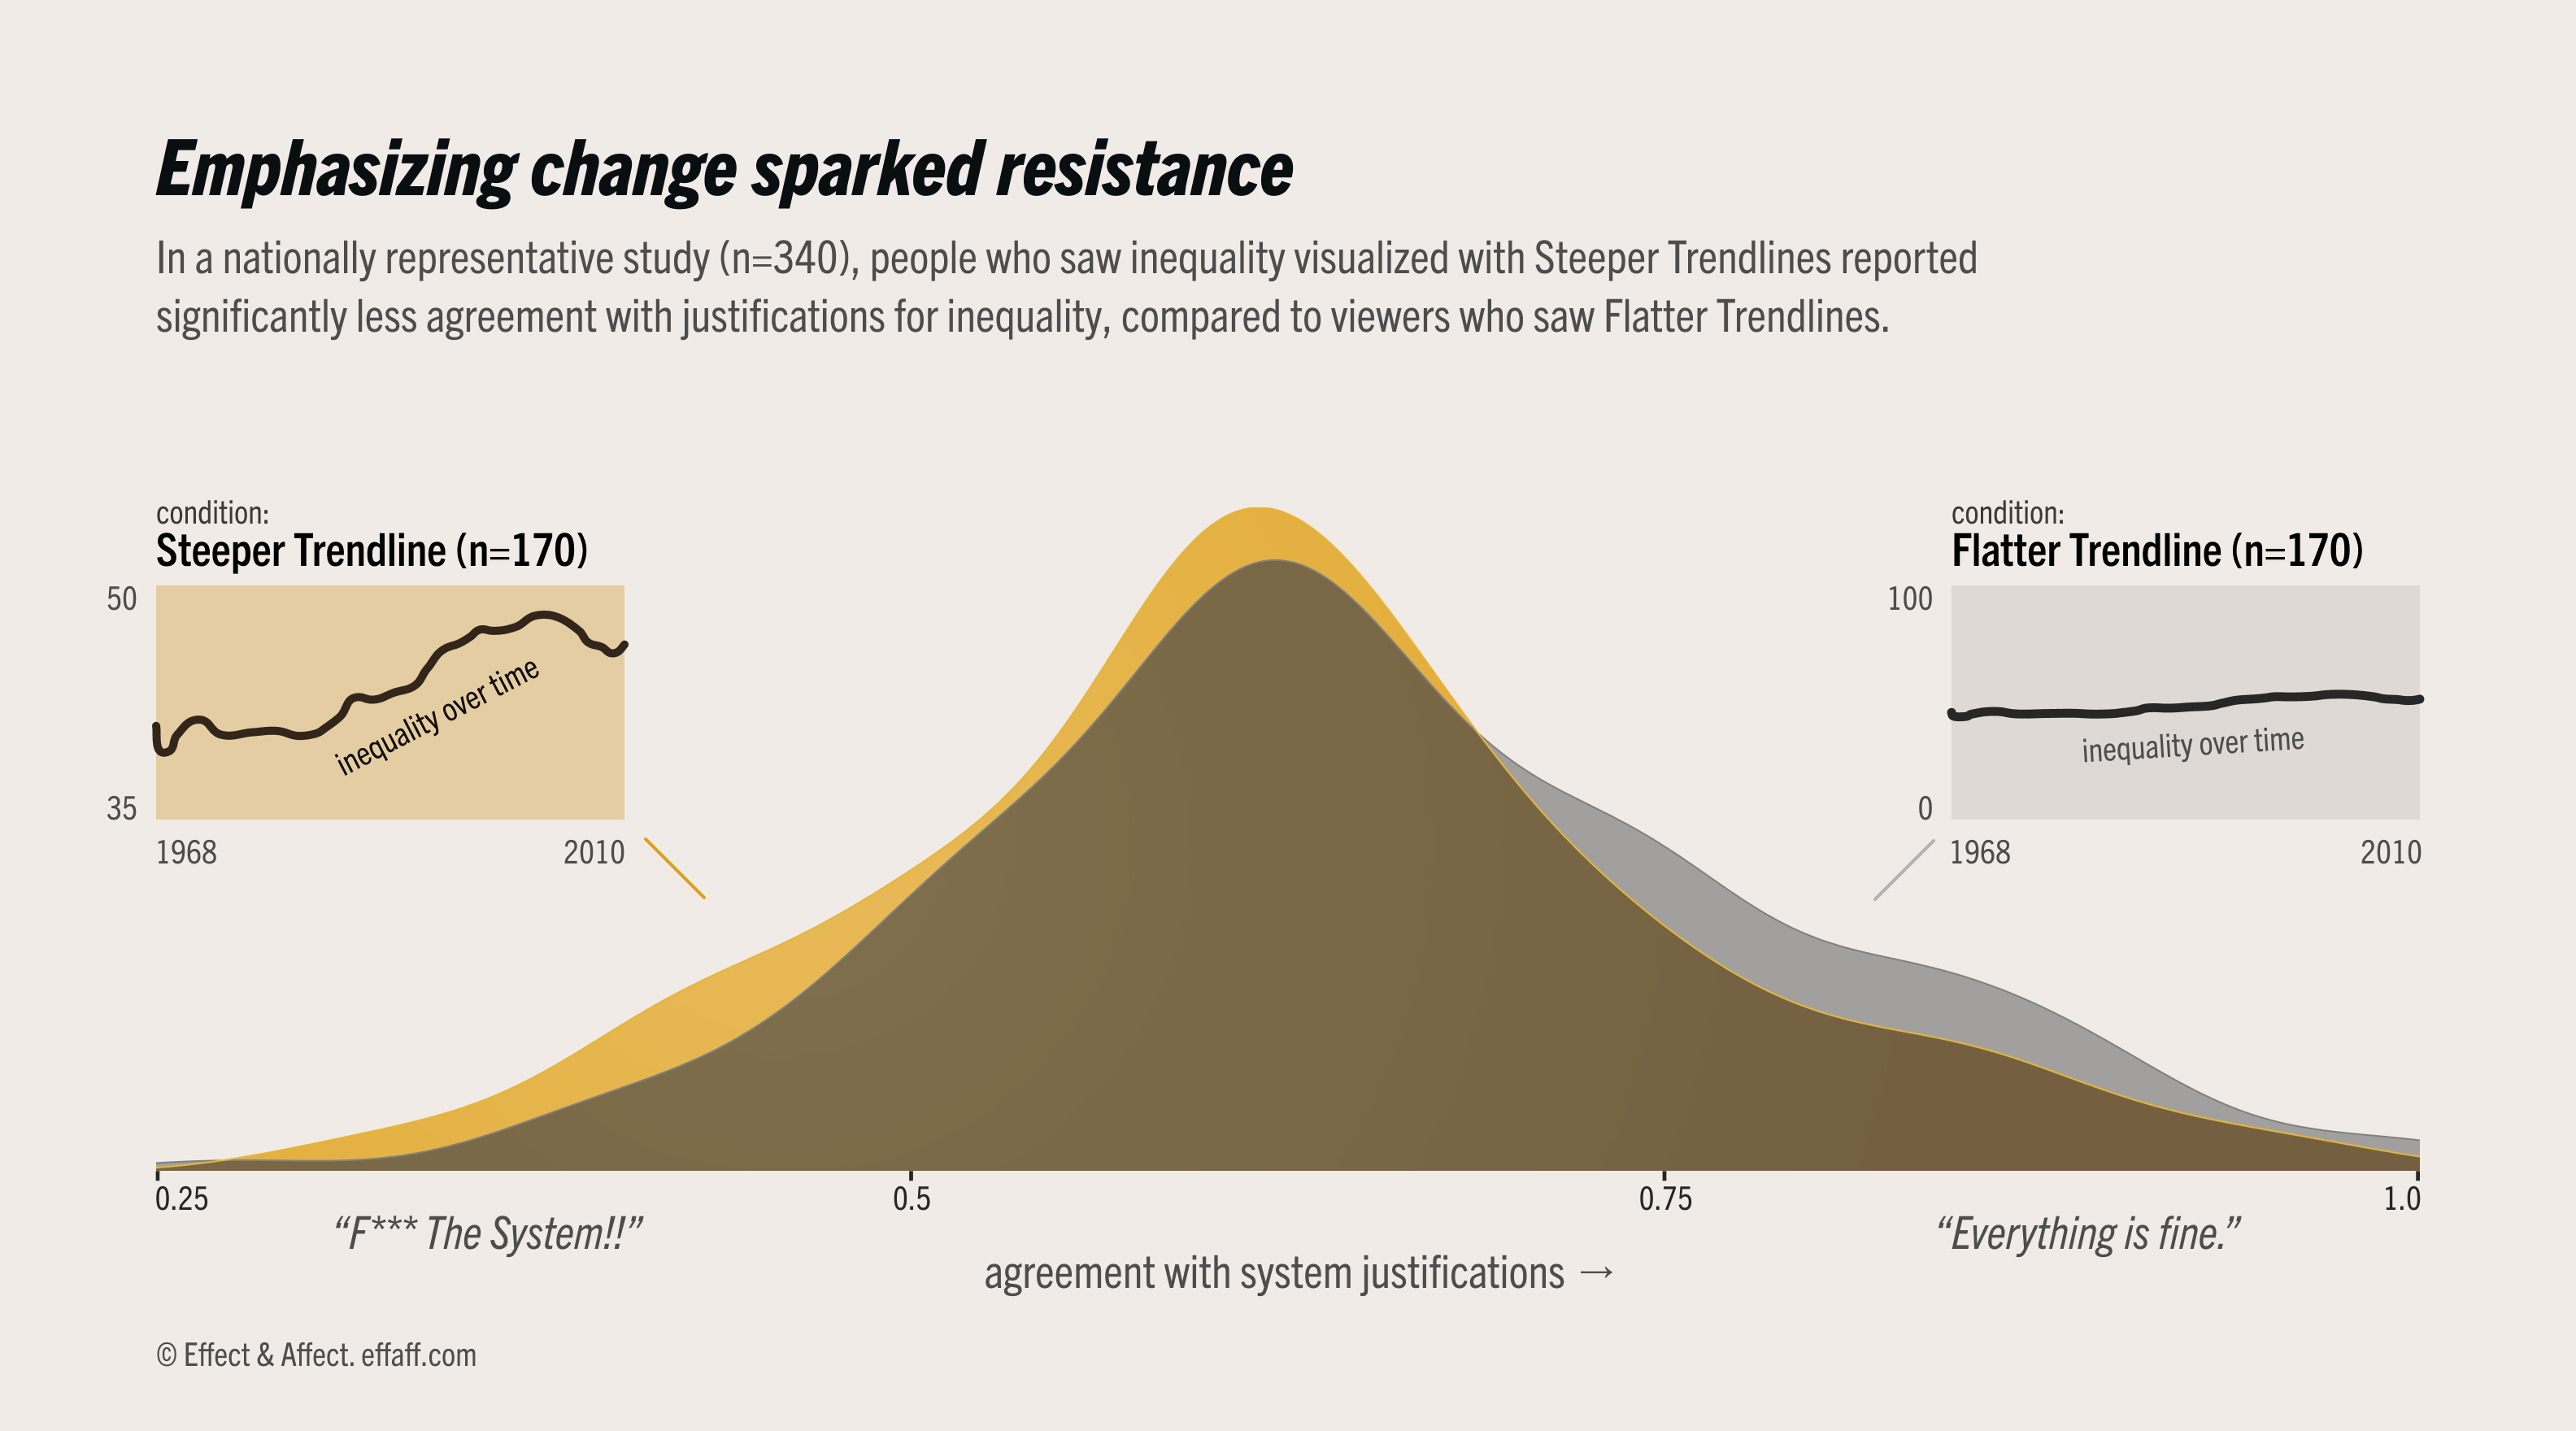
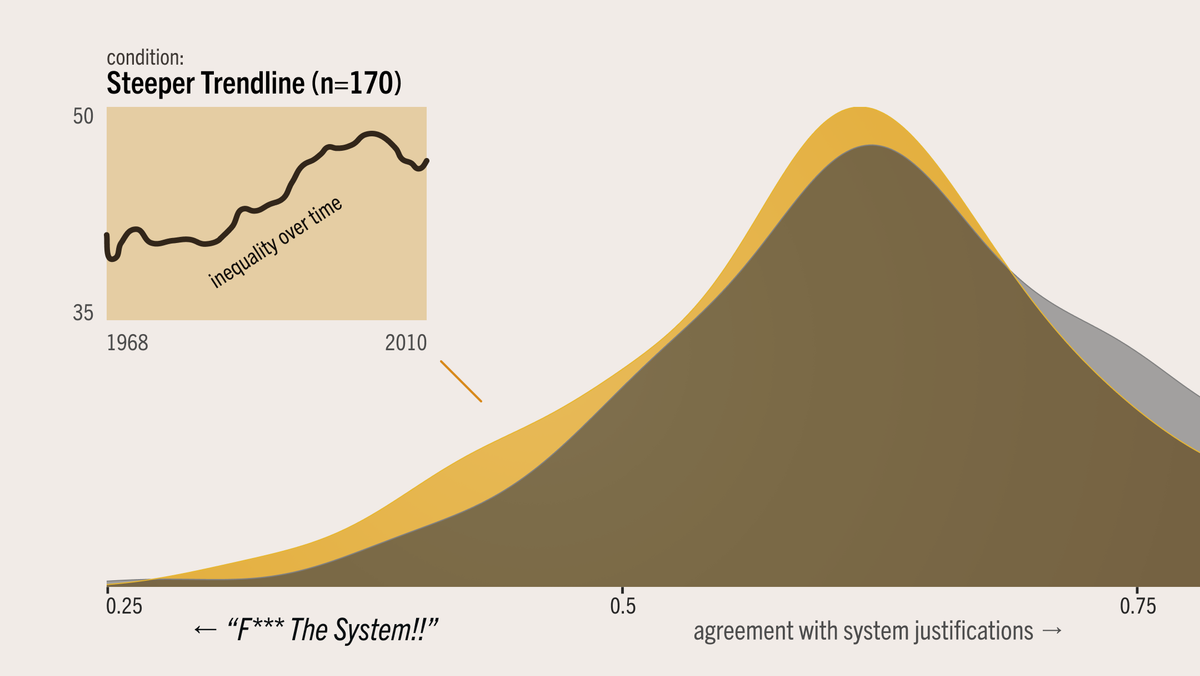
Instead of resignation, the Steeper Trendline chart sparked resistance. It seemed to counteract system justification and slightly (but significantly) reduce viewers' support for inequality in the United States. Even though participants agreed with system justifications overall, the Steeper Trendline chart increased the number of people who rejected these justifications by 1.5x.
This spark of resistance has two important implications.
First, agitating the status quo is a useful feature for advocacy. In the face of unfair systems, it’s good to stir up dissent and discontent. It’s good to be grumpy. We don’t want to "adjust" to injustice.
“There are some things in our society, some things in our world, to which we should never be adjusted... We must never adjust ourselves to racial discrimination and racial segregation. We must never adjust ourselves to religious bigotry. We must never adjust ourselves to economic conditions that take necessities from the many to give luxuries to the few.” "The Role of the Behavioral Scientist in the Civil Rights Movement,” Martin Luther King Jr, 1968
Second, sparking resistance hints at the power of visualizing change. System justification depends on people feeling stuck. So maybe the Steeper Trendline chart helped viewers feel less stuck. Even though it showed outcomes getting worse, by emphasizing change perhaps it helped offset the underlying cycle of fatalism.
This shows potential for a broader principle of equitable data design: Perhaps by visualizing change, charts can instill hope by reminding us that change is possible.
We'd still need direct research to support a principle like this, but we know that information can influence related beliefs and judgements. For example, learning that depression isn't forever helps people work through it faster. Additionally, researchers in other fields have shown promising examples of charts sparking resistance:
- Timeseries charts can influence justifications for economic inequality and legislative gender representation.
- Aggregated bar charts can impact opportunity beliefs and policy preferences.
- Sankey diagrams of social mobility can shift economic fairness judgements.
By reminding viewers that systems can change, perhaps charts like these can keep us motivated while we struggle to make these systems better.
What does this mean for dataviz?
Dataviz often shows disaster. And that's fine. It’s an effective tool for communicating problems affecting the world around us. But dataviz shouldn't linger in despair.
“I never have been in despair about the world. I’ve been enraged by it. I don’t think I’m in despair. I can’t afford despair. I can’t tell my nephew, my niece. You can’t tell the children there’s no hope.” James Baldwin, 1987
It’s neither truthful nor helpful to only show the bad or imply that the bad times will last forever. Even when the data doesn’t support uplifting tales of progress, even when the data is depressing, we’re never stuck. Bad outcomes come from bad choices, but there's no law of human nature that says we can't make better choices in the future. The "arc of the moral universe" doesn't bend itself, so there’s always a story about the possibility of change.
- Information design choices can impact our beliefs about how systems work and how they can change. These beliefs, in turn, affect our ability to adapt, improve, and fight for the changes we want to see.
- If our charts can’t inspire hope, perhaps they can at least fight despair. When visualizing social outcomes, consider opportunities to remind viewers that the underlying systems are malleable.
Data stories can show more than “what is.” They can also remind us that “what is” can change. And change you can see is change you can believe.
You can follow Eli here on BlueSky and Gabby here on LinkedIn.